Report Builder
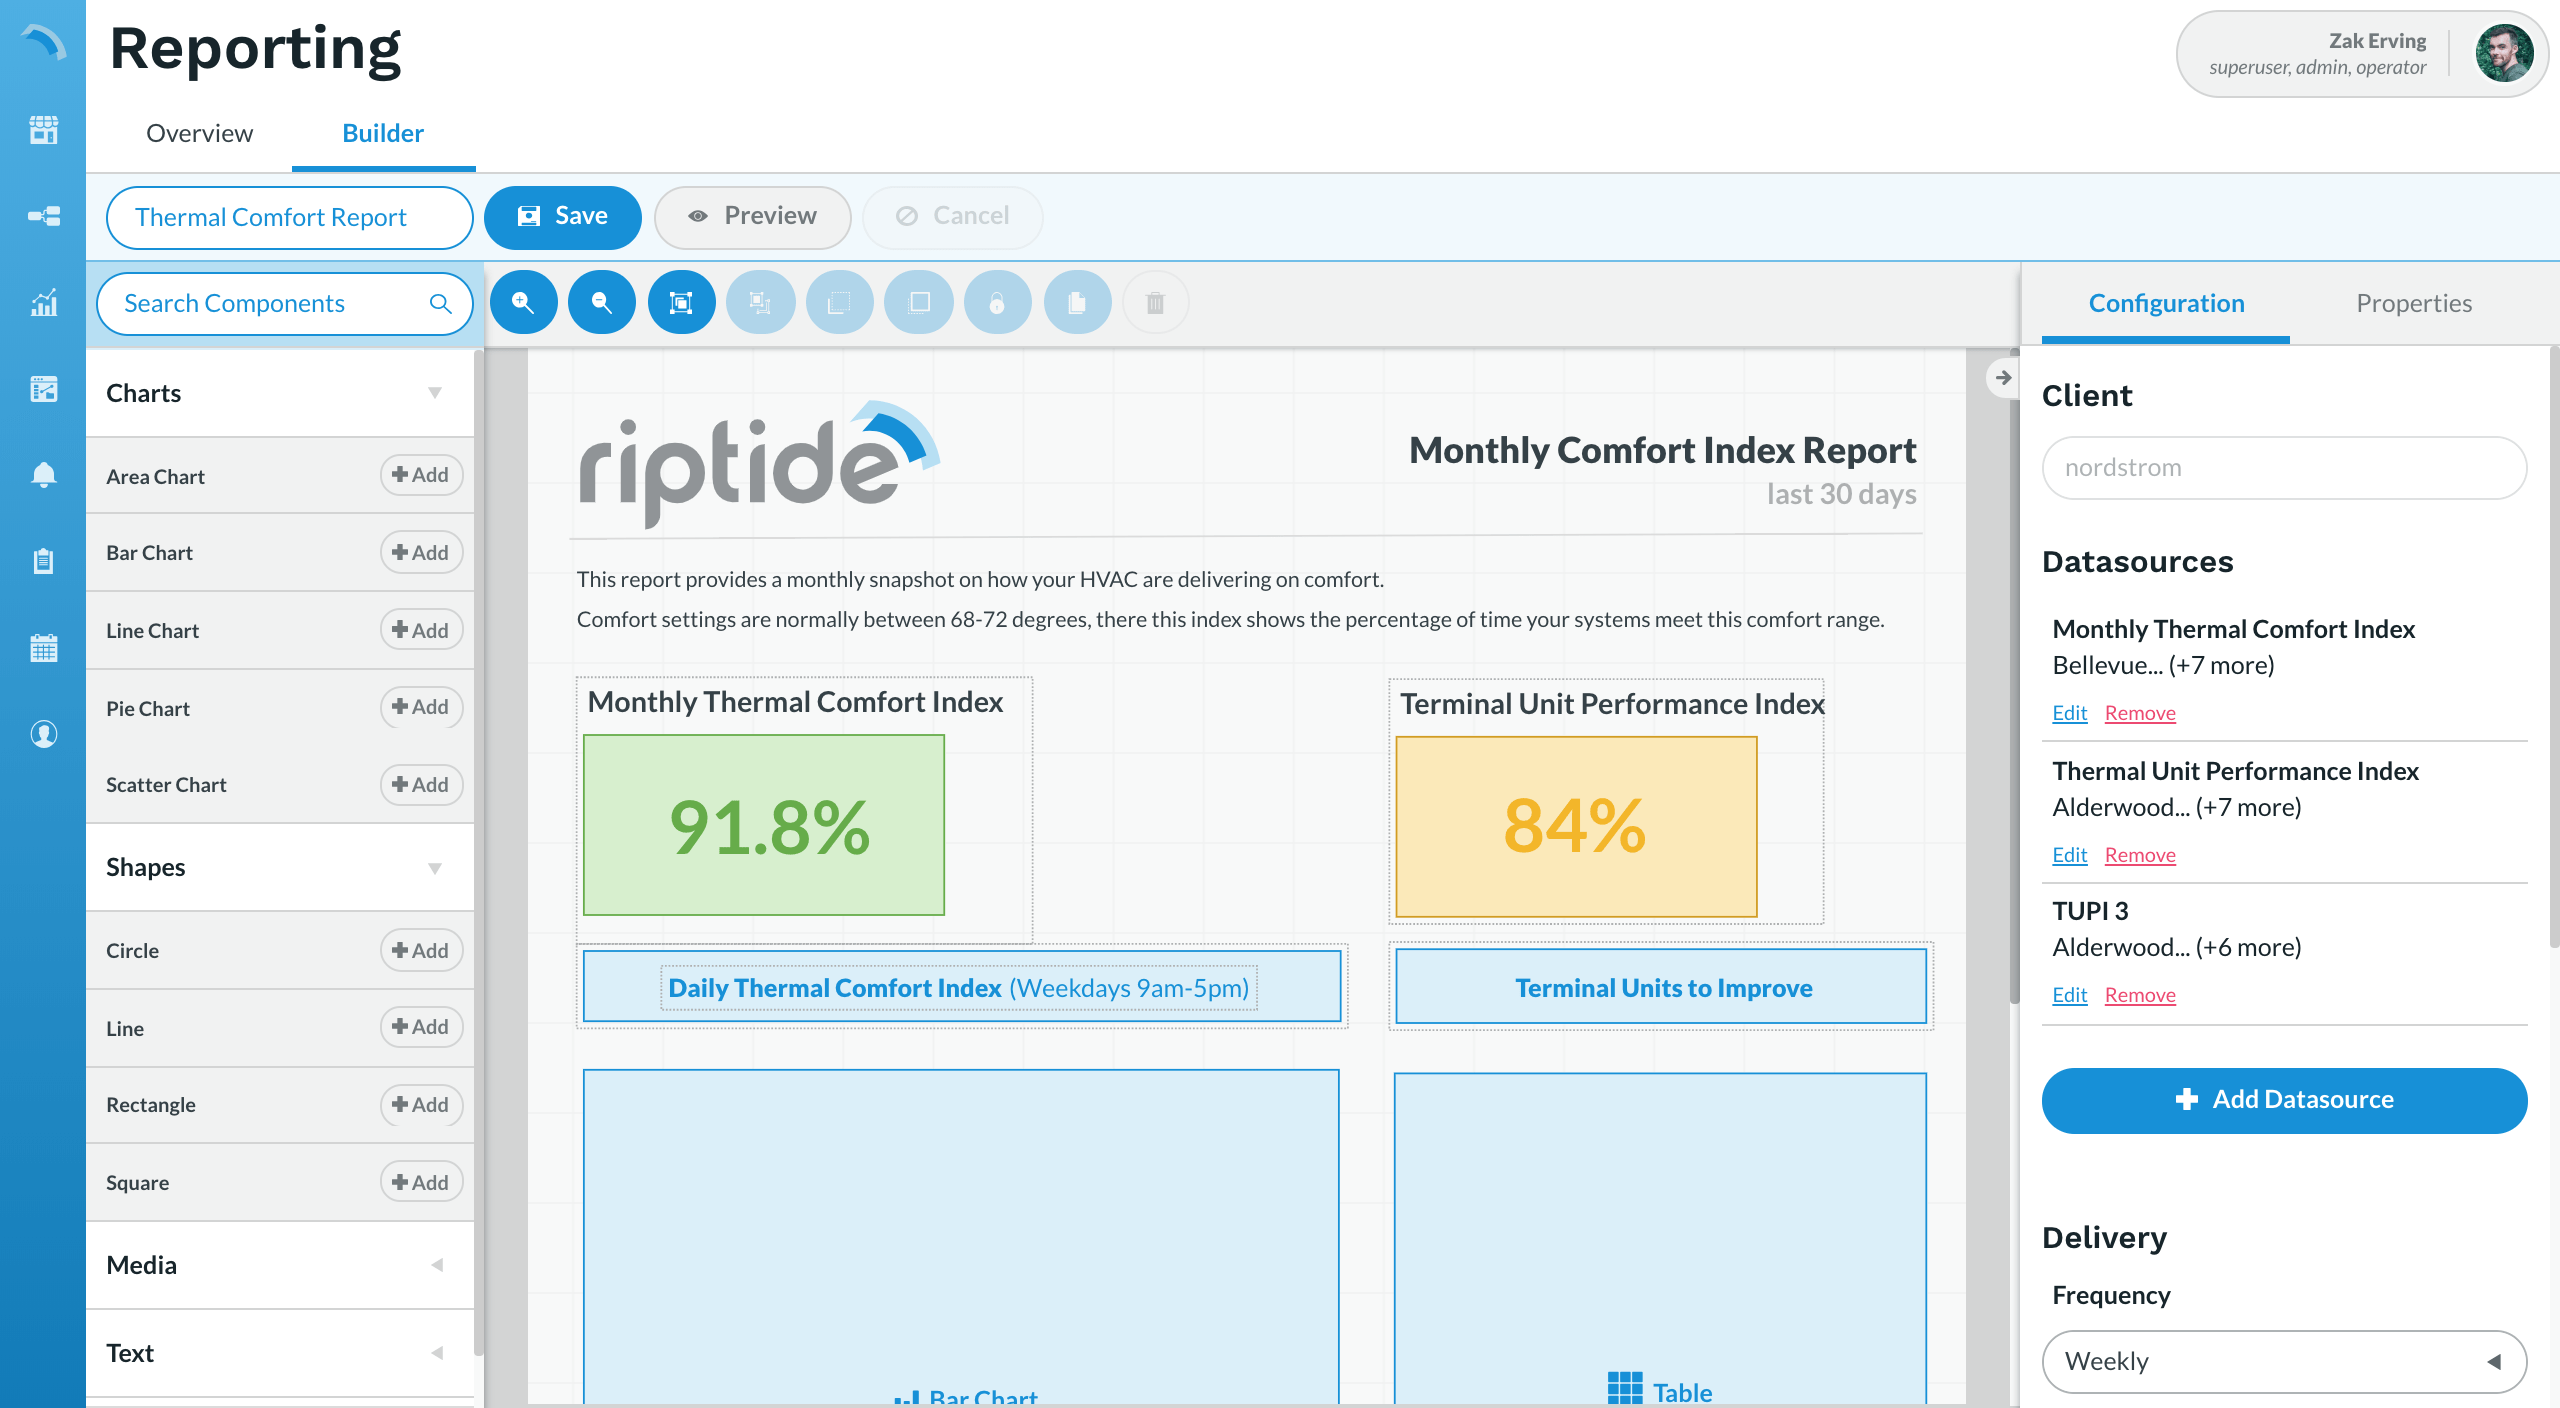
a drag-and-drop reports builder that outputs to HTML and PDF
Background
Executives and managers often don't often have the time or resources to dig into an entire region's worth of building data. They need to see rollup data presented in a way that is easily scannable and executable, and it needs to be available on-demand and in regular intervals. Bonus points if this data is sharable.
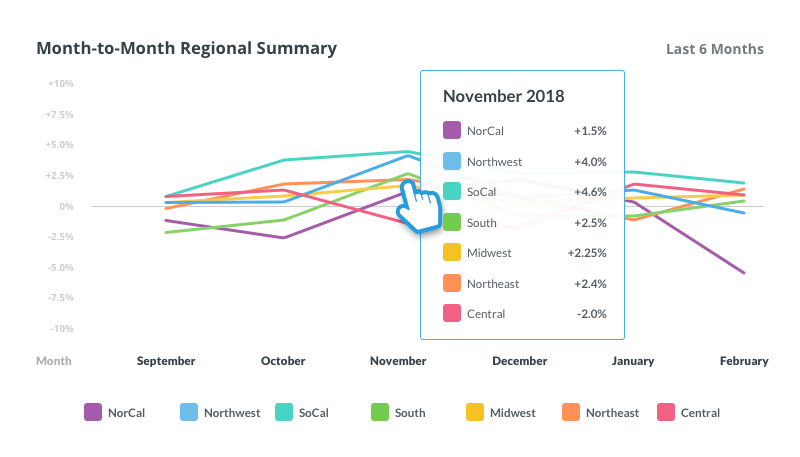
When viewed in the browser, the reports would have interactive features like tooltips to show detail
Process
The report builder was one of the last projects I got to work on before Riptide was acquired by Turntide. Here, it was apparent that many of the assumptions we made years ago were correct. The product requirements aligned neatly with the large buckets we had defined in other applications (e.g., Equipment Builder, Flow Editor), allowing us to build the first draft using familiar paradigms. From there, it was a matter of iterating on the smaller components—like how to configure a mailing list from the properties drawer—before delivering an enterprise-ready application.
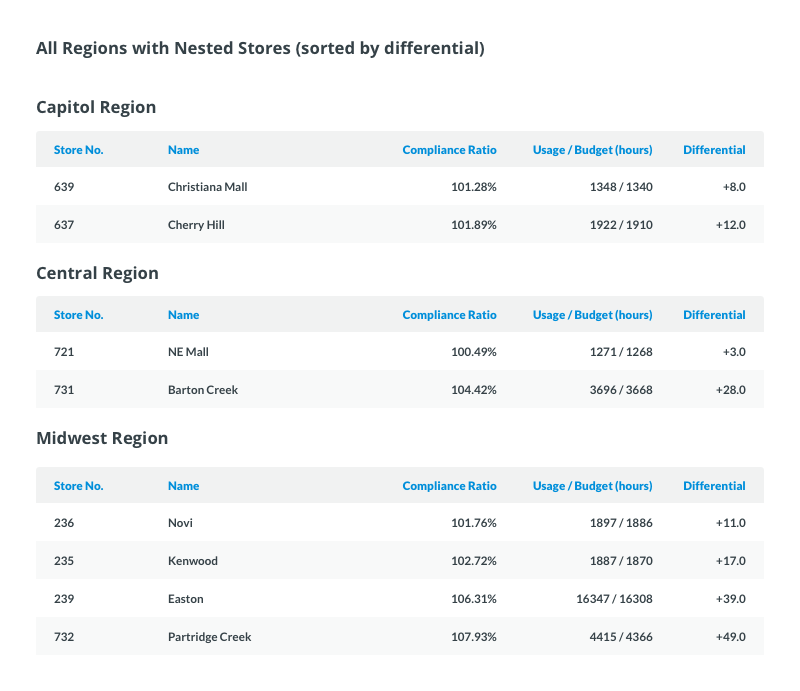
One of the most-requested features for the report builder was rollup data for different regions
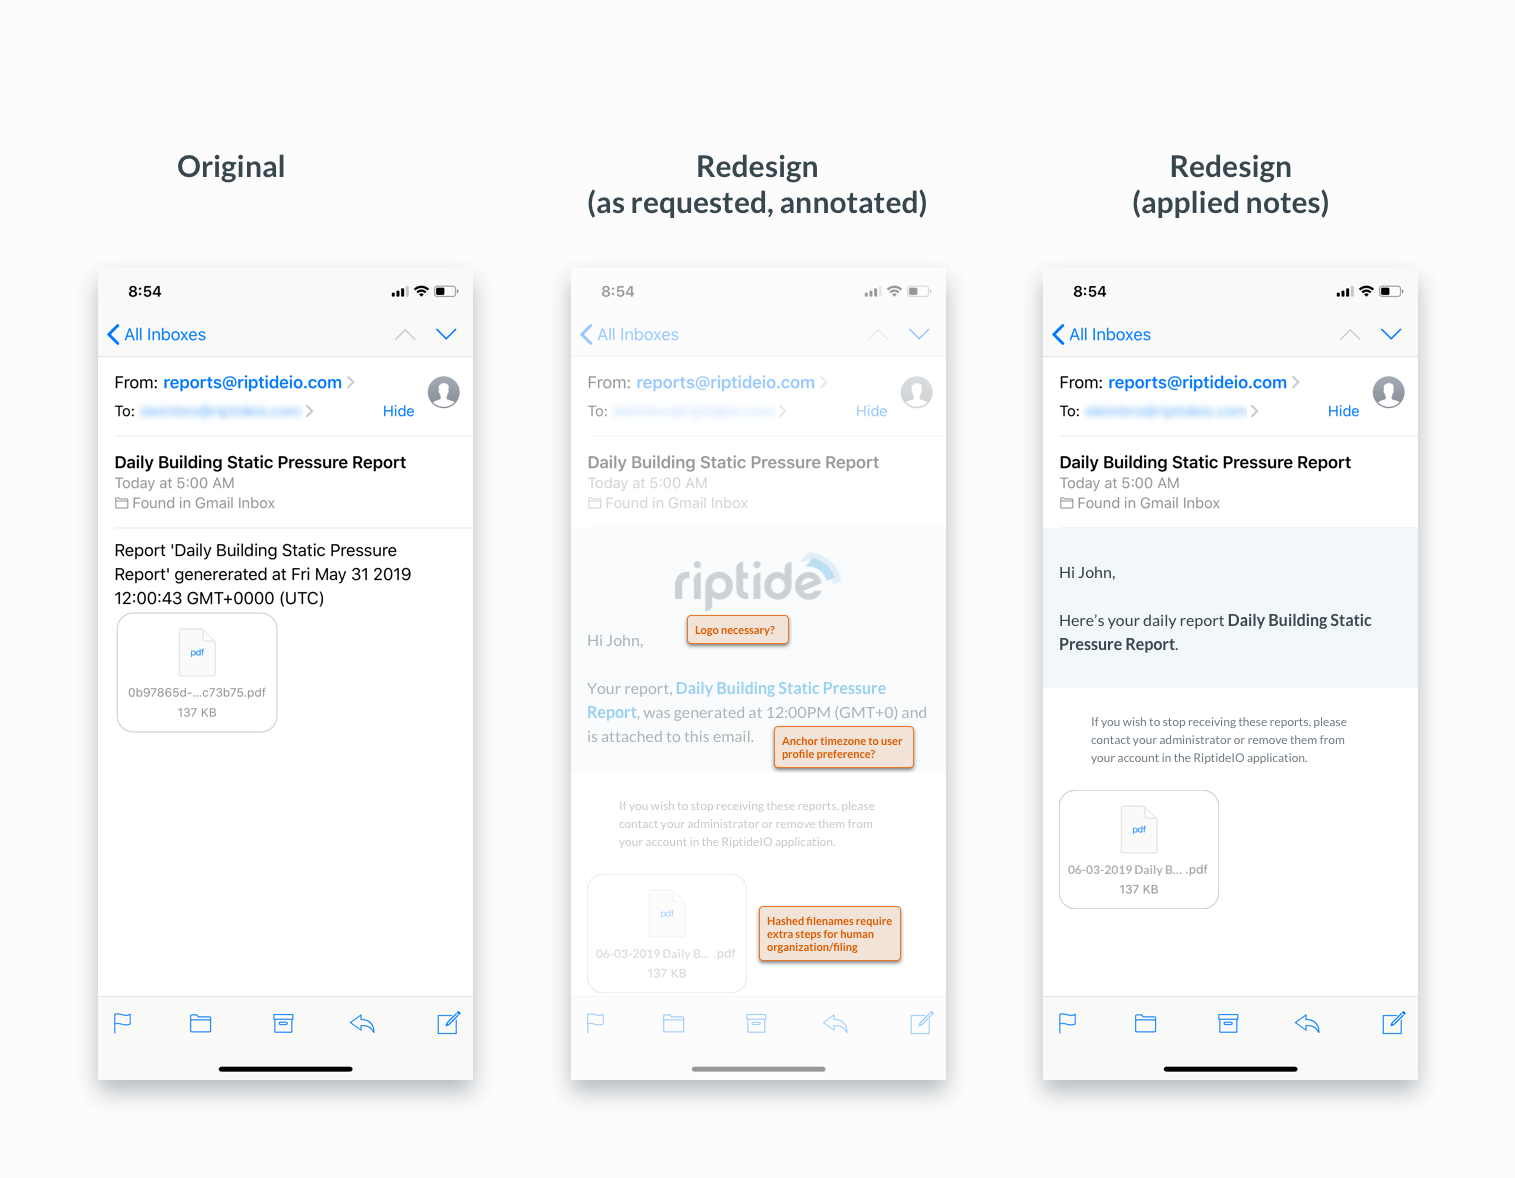
Report studies for mobile email
Takeaway
This is a great example of being able to recycle design paradigms when they're made right the first time. The overall layout and functionality of the Report Builder borrowed heavily from the Equipment Builder: the left drawer is for parts, the right drawer is for modifying data, and the canvas is topped by a toolbar that arranges selected parts. Instead of using SVGs, however, the Report Builder used D3.js for the charts. Reports could be exported as a static PDF or as an HTML with a sharable link.